
The S&P 500 dropped 5.1% last week as investors digested new inflation data released on Friday. May’s Consumer Price Index (CPI) report showed a reacceleration of inflation after a brief reprieve in April. Headline CPI increased 8.6%, which is the fastest pace since December 1981. The primary drivers of inflation were energy and food prices. Gasoline prices increased 4.1% in May, a big reversal from the 6% decline in April. Food prices, primarily from grocery store spending, climbed 1.4%.
Key Points for the Week
- The Consumer Price Index, a measure of inflation, increased a higher-than-expected 8.6% in May, the fastest pace since December 1981. Core CPI, which excludes food and energy prices, rose 6%, down from 6.2% in April.
- The U.S. trade deficit fell 19.1% in April as imports fell and exports increased.
- Stocks and bonds declined as markets prepared for the Federal Reserve to hike interest rates further to control inflation.
Core CPI, which removes the effects of food and energy, decreased slightly from 6.1% to 6% but remained stubbornly high. The primary driver was vehicle prices with used car prices increasing 1.8% since April.
Markets responded to the higher inflation read by pricing in more aggressive rate hikes, which hurt both stock and bond indices. The S&P 500 declined 5% for the week, once again testing bear-market territory, falling 17.6% so far this year. At the time of publishing early Monday morning, stocks had extended their losses and were poised to decline more than 20% from their highs. Bonds, as measured by the Bloomberg U.S. Aggregate Bond Index, declined 0.9% to bring their year-to-date total to -8.9%.
The U.S. trade deficit fell 19.1% in April. U.S. imports declined sharply, following several months of businesses briskly increasing inventory in the wake of supply-chain disruptions. Meanwhile, exports continued to grow through April, thanks to more food shipments, which jumped sharply, the strong performance of industrial supplies, and capital goods. Still, the trade deficit in April remains large compared to pre-pandemic levels. This continues to reflect the strength of the U.S. economy compared to other major economies, which is a trend economists expect to continue for the foreseeable future.
The big event this week will be the Federal Open Market Committee meeting, in which the Fed is expected to increase the federal funds rate by 0.5% for the second meeting in a row. The market will be paying attention to Chair Jerome Powell’s comments on expectations for the July and September meetings.
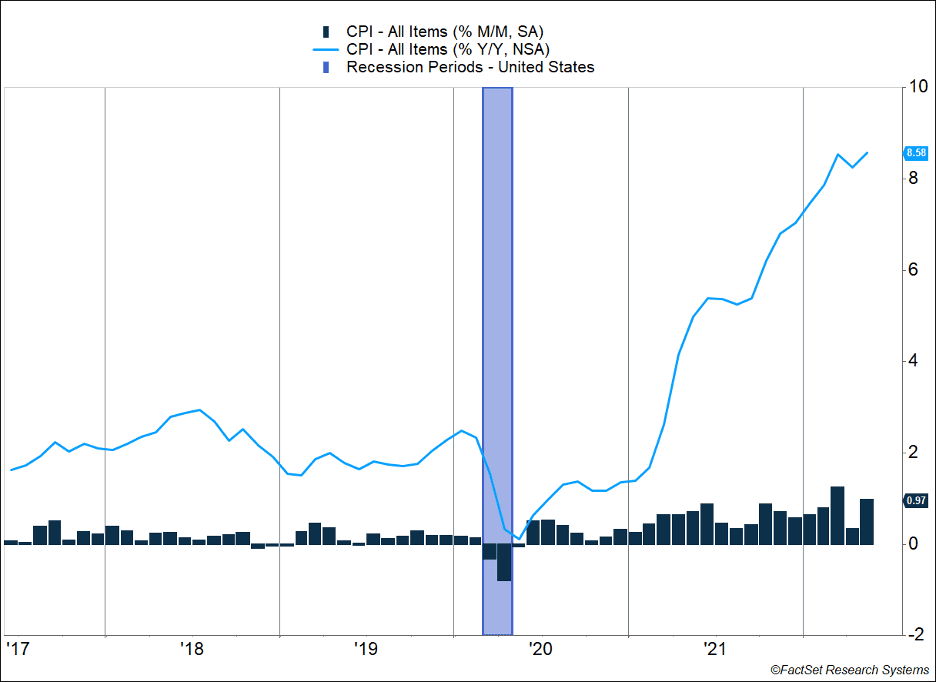
Figure 1
Persistently High
Last month, it looked like inflation pressures were starting to subside. Gas prices declined by 6%, food price increases were starting to slow, and vehicle prices had fallen for three straight months. The FOMC set the stage for 0.5% rate increases for June and July, but there was some indication the Fed would pause hikes in September if inflation moderated further.
Unfortunately, consumer price increases reaccelerated in May. Headline inflation increased 1%, which brought the yearly number to +8.6%, the highest level since December 1981 (see Figure 1). Energy prices led the way as WTI crude oil increased from around $105 per barrel to $115. Gas and natural gas prices increased right along with it. Overall, energy prices only account for 7% of the weight in the basket but accounted for 25% of the gain. Food prices were another big contributor, increasing 1.2% in May. Grocery store prices generated the most pressure, increasing 1.4% versus a 0.7% increase for eating out.
The stubbornness of core CPI, which removes the impact of energy and food, was most disappointing. Automobile prices were main drivers, especially as used cars climbed 1.8% since April. This was the first time used car prices increased since January and is a sign the sector continues to struggle with supply constraints, particularly in microchips. Vehicle inventories are only 17% of the levels they were prior to the COVID-19 pandemic.
The main reason for the Fed’s “transitory” thesis last year was members expected supply-chain constraints would ease and consumer behavior would normalize after the pandemic ended. This has occurred to a degree, but not nearly as quickly as experts thought. The war in Ukraine and the COVID shutdown in China have extended the supply chain issues.
At the same time, there is some evidence that demand for goods in the U.S. is falling, which caused some prices to fall. The report showed a decline in prices of some goods, such as major appliances (-2% month over month), bedroom furniture (-1.6% month over month), and sporting goods (-0.2% month over month). Also, several major retailers have indicated they have a lot of inventory built up, which will likely lead to price cuts over the summer. But this good news wasn’t nearly enough to offset the large price increases in other parts of the economy.
One of the side-effects of elevated inflation is consumer debt is beginning to rise again. During the pandemic and its after-effects, borrowers had begun to pay off debt as they received government stimulus checks and had fewer ways to go out and spend money. At the same time, personal savings reached levels not seen since World War II. Now, with no further stimulus checks and consumers experiencing higher inflation, revolving credit crossed the record high last seen in February 2020, reaching $1.1 trillion. This spending could be a good sign for the economy as consumers seem comfortable adding to their debt but could also be a concerning trend for personal balance sheets, especially if the jobs market reverses course and becomes tighter.
This week the market will be paying close attention to the Federal Open Market Committee meeting, in which it’s widely expected that Jerome Powell and the rest of the Federal Reserve governors will approve a 0.5% increase to the federal funds rate. While there shouldn’t be a surprise there, special attention will be paid to any hints at a change from the projected 0.5% increase in July and any comments on expectations for September. The market already responded last week to expectations that rates will increase, but additional clarity from the Fed will be helpful to establish a direction for the market moving forward.
It’s also important to acknowledge that talk of a recession has picked up recently. The Fed has a difficult job of trying to bring down inflation by raising interest rates just enough without turning economic growth negative. The good news is the economy still appears strong — consumer demand is high, unemployment is low, and the economy has added more than 1 million jobs in the past three months.
Stubborn inflation has raised a concern that additional interest rate hikes will pressure markets now and the economy in the future. Last week’s performance reflects those concerns. It also reflects concerns the decline in some speculative investments may trigger short-term selling pressures across markets. Last week’s decline and subsequent weakness in pre-market indicators this week suggest the S&P 500 may decline more than 20% from its previous peak. While some short-term traders may be pushed into selling based on short-term concerns, now is a good time to take advantage of your longer horizon. If you are nervous, check with your advisor and see if this short-term volatility has had any effect on your long-term plan.
–
This newsletter was written and produced by CWM, LLC. Content in this material is for general information only and not intended to provide specific advice or recommendations for any individual. All performance referenced is historical and is no guarantee of future results. All indices are unmanaged and may not be invested into directly. The views stated in this letter are not necessarily the opinion of any other named entity and should not be construed directly or indirectly as an offer to buy or sell any securities mentioned herein. Due to volatility within the markets mentioned, opinions are subject to change without notice. Information is based on sources believed to be reliable; however, their accuracy or completeness cannot be guaranteed. Past performance does not guarantee future results.
S&P 500 INDEX
The Standard & Poor’s 500 Index is a capitalization-weighted index of 500 stocks designed to measure performance of the broad domestic economy through changes in the aggregate market value of 500 stocks representing all major industries.
Bloomberg U.S. Aggregate Bond Index
The Bloomberg U.S. Aggregate Bond Index is an index of the U.S. investment-grade fixed-rate bond market, including both government and corporate bonds.
CME Group, CME Fed Watch Tool, June 13, 2022. https://www.cmegroup.com/trading/interest-rates/countdown-to-fomc.html
U.S. Bureau of Labor Statistics, Consumer Price Index Summary, June 10, 2022. https://www.bls.gov/news.release/cpi.nr0.htm
BEA, “U.S. International Trade in Goods and Services, April 2022,” June 7, 2022. https://www.bea.gov/news/2022/us-international-trade-goods-and-services-april-2022
CNBC, “Credit card balances spike to $841 billion after stimulus checks helped reduce debt,” June 9, 2022. https://www.cnbc.com/2022/06/09/credit-card-balances-spike-after-stimulus-checks-helped-reduce-debt.html
Compliance Case # 01400538
